Modelling Match Events — 52,000 Moments, and a Minute That Isn't a Number
Every fact table we’d built up to this point measured something that was already over. fct_team_matches measures a match from the final whistle. fct_player_appearances measures a player’s ninety minutes, summarised. fct_team_transfers measures a completed move. Match events were the first time the grain came down to a moment: the 63rd-minute equaliser, the second yellow, the VAR check that took a goal away three minutes after everyone had finished celebrating.
That shift — from what happened to when it happened, in what order, and what the score was at that instant — is a much bigger modelling change than it sounds. It brought two brand-new dimensions into the warehouse, forced a rethink of what a fact table’s reload unit should be, and turned up a bug that had been sitting quietly in a different fact table for months. This post is the story of fct_match_events: 52,071 events across 3,739 matches in two leagues, and the design decisions behind each one of them.
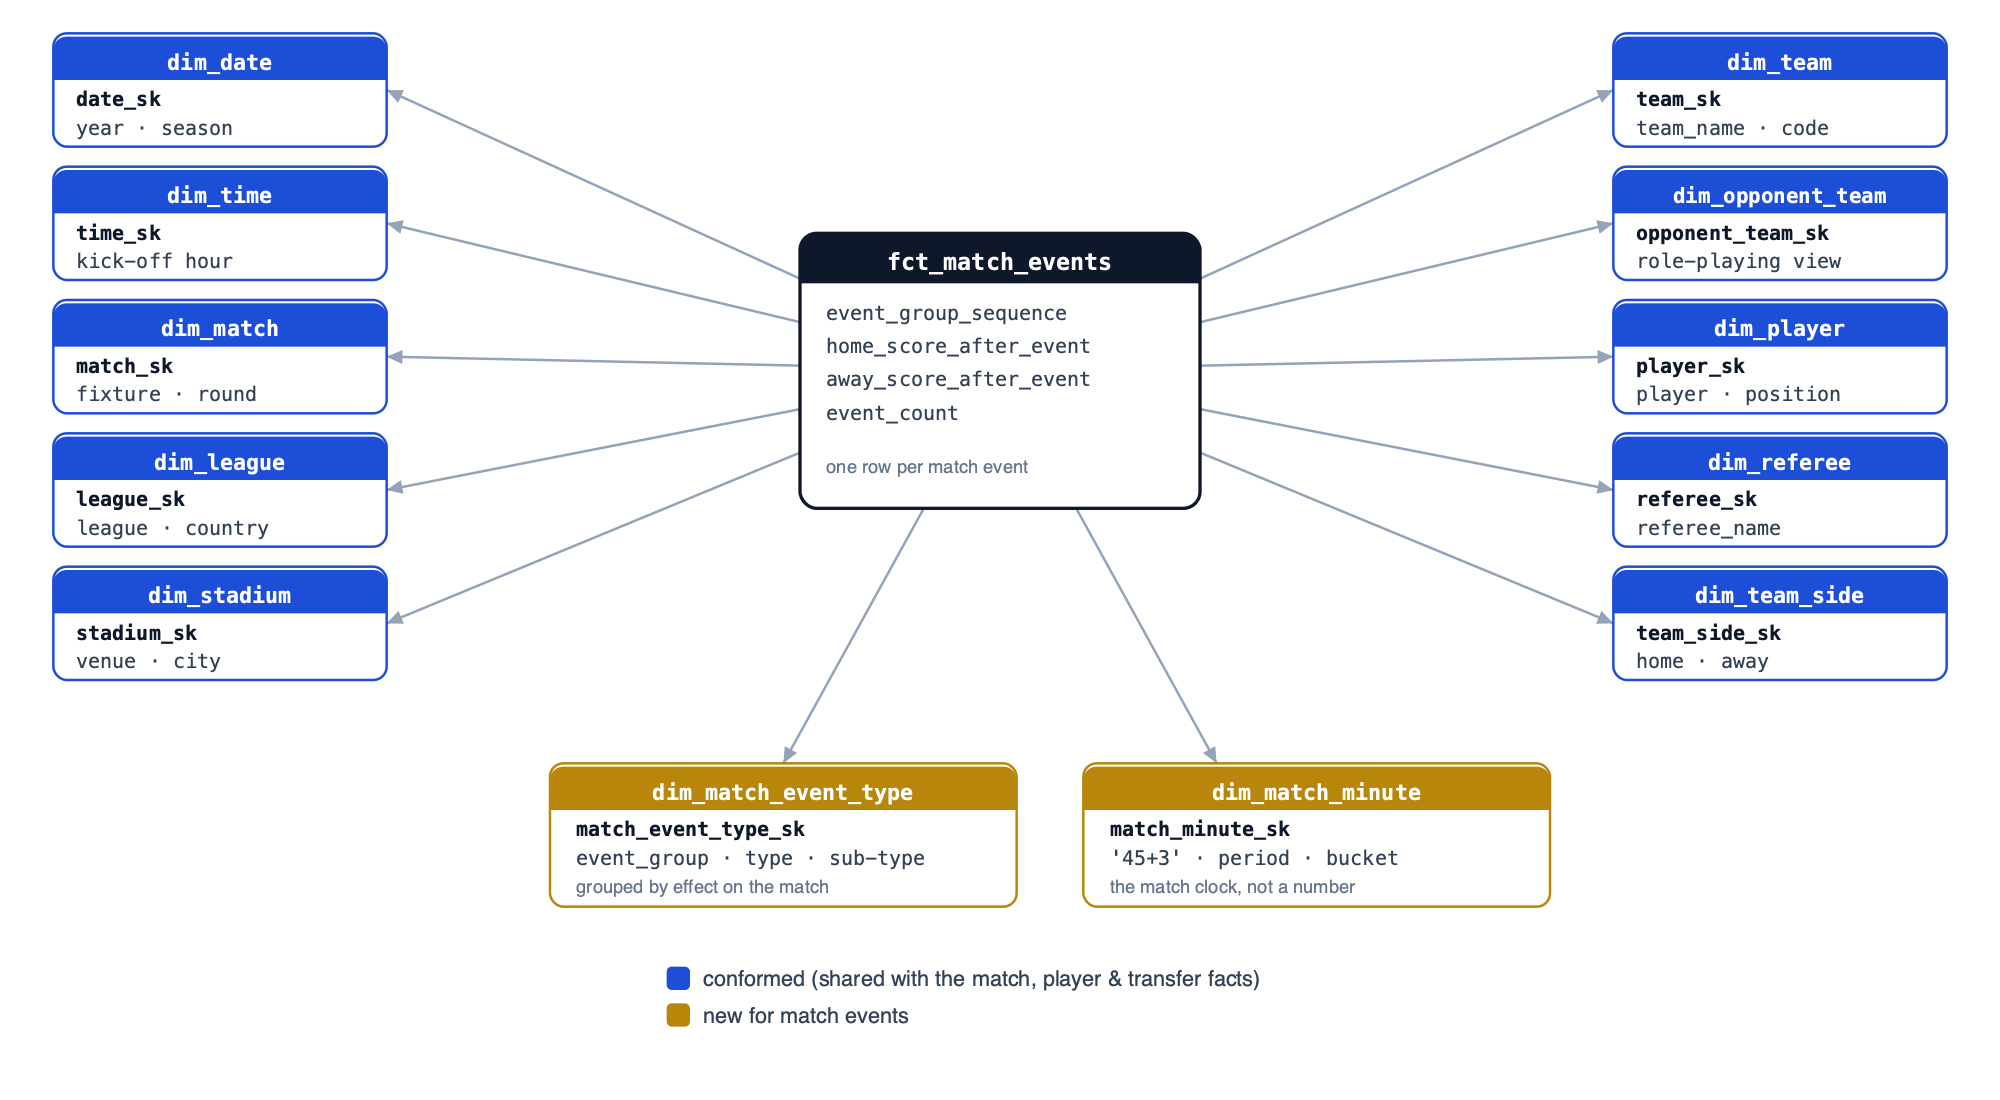
The model we’re building toward. Twelve foreign keys — and only two of them (gold) are new. The other ten (blue) were already in the warehouse, conformed, waiting. More on why that matters at the end.
The raw shape
The first surprise is that match events don’t come from an events endpoint at all. They arrive nested inside the fixture payload, and the silver layer unnests them:
SELECT
    (event->>'id')::INTEGER             AS id,
    f.id                                AS fixture_id,
    (event->>'period_id')::INTEGER      AS period_id,
    (event->>'participant_id')::INTEGER AS team_id,
    (event->>'player_id')::INTEGER      AS player_id,
    event->>'result'                    AS result,      -- '2-1' after a goal
    (event->>'minute')::INTEGER         AS minute,
    (event->>'extra_minute')::INTEGER   AS extra_minute,
    (event->>'sub_type_id')::INTEGER    AS sub_type_id,
    (event->>'sort_order')::INTEGER     AS sort_order,
    event->>'type_developer_name'       AS type_developer_name,
    ...
FROM src AS f,
unnest(json_transform(f.raw_json::VARCHAR, '{"events": ["JSON"]}').events) AS t(event)
That “events live inside the fixture” detail looks like a plumbing footnote. It turns out to be the single most consequential fact about this dataset, and we’ll come back to it when we talk about reloads.
Four columns in that list drove almost every decision downstream: type_developer_name + sub_type_id (what kind of moment this was), minute + extra_minute (when), result (the score after it), and sort_order (which is not what it looks like).
The grain: one row per event
This decision was, for once, easy. The event is the measurement — a classic transaction fact. One row per event, an event_count = 1 counting fact, and a type dimension to say what kind of event it is. We’d used the same shape twice already: dim_appearance_type on the appearances fact, dim_transfer_type on the transfers fact.
The alternative — a wide “match summary” fact with goals_in_first_15, cards_after_75, and so on — is the classic trap. It answers the questions you thought of in advance and nothing else. Keep the grain atomic and every timing question becomes a GROUP BY, including the ones nobody has asked yet. That’s the whole bet of dimensional modelling, and it’s the reason this one fact ended up feeding six different dashboard sections across two websites without a single change to the fact itself.
A dimension that classifies by effect, not by taxonomy
dim_match_event_type sits at (type × sub-type) grain — 66 rows — with a three-level hierarchy: event_group → event_type_name → event_sub_type_name.
The interesting decision is the top level. The provider’s taxonomy has GOAL, OWNGOAL and PENALTY as three separate types, which is perfectly reasonable as a taxonomy. But we grouped them together anyway:
CASE
    WHEN event_type_code IN ('GOAL', 'OWNGOAL', 'PENALTY')             THEN 'Goal'
    WHEN event_type_code = 'MISSED_PENALTY'                            THEN 'Missed Penalty'
    WHEN event_type_code IN ('YELLOWCARD', 'YELLOWREDCARD', 'REDCARD') THEN 'Card'
    WHEN event_type_code = 'SUBSTITUTION'                              THEN 'Substitution'
    WHEN event_type_code IN ('VAR', 'VAR_CARD')                        THEN 'VAR'
    ELSE 'Unclassified Event Group'
END AS event_group
The rule we settled on: group by the effect on the match, not by the provider’s category. An own goal is a goal — the scoreboard moves, the game state changes, somebody is now chasing the match. A scored penalty is a goal. A missed penalty is not, so it gets its own group rather than being lumped in with goals or dropped. Every downstream “when do goals happen” chart is a filter on event_group = 'Goal', and it is correct without anyone having to remember the three-way type split.
The second decision was to derive the dimension from the observed event stream rather than hand-writing the rows, which we’d done for dim_transfer_type. Sportmonks has a large and growing type catalogue; hard-coding it would mean a code change every time they introduce a sub-type. So the model reads the distinct (type, sub-type) pairs actually present in the data — but derived dimensions have an obvious failure mode: surrogate keys that shuffle on every rebuild, silently repointing every fact row at the wrong dimension member.
The fix is a merge-incremental materialisation keyed on the provider’s code pair:
{{ config(
    materialized='incremental',
    incremental_strategy='merge',
    unique_key=['event_type_code', 'event_sub_type_code'],
    merge_update_columns=['event_group', 'event_type_name', 'event_sub_type_name']
) }}
New combinations get appended with the next free SK; existing ones keep the key they were born with, forever. Display names can be corrected in place; keys never move.
And then the part we like most. A genuinely new event type — something the CASE above has never seen — doesn’t get quietly bucketed somewhere plausible. It lands in 'Unclassified Event Group', which is not in the accepted_values test for that column. The test fails, on purpose, and somebody has to make a real classification decision. A dimension that grows itself is convenient; a dimension that grows itself and refuses to guess is safe.
The minute that isn’t a number
dim_match_minute was the genuinely novel one — a “when inside the match” dimension, sitting alongside dim_date (“which day”) and dim_time (“what hour of the day”). Three different kinds of time, three separate dimensions, all on the same fact.
The naive version is minute INTEGER on the fact and no dimension at all. It breaks immediately, because football’s clock is not a number:
45+3is a real minute, and it is not minute 48. It’s stoppage time in the first half — a distinct, meaningful moment with its own drama.90+4is arguably the most meaningful minute in the sport.- You can’t derive the half from the number. Minute 45 might be the last minute of the first half or an early moment of the second; the source’s period is the only way to know.
- Everyone wants buckets, and the sensible bucketing isn’t uniform:
0-15,16-30,31-45, then45+as its own bar,46-60,61-75,76-90,90+.
So the grain is one row per displayed minute, with every stoppage minute as its own row, and the natural key is the label a fan would recognise:
SELECT
    minute_of_match * 100 + stoppage_offset AS match_minute_sk,
    minute_label,      -- '63', '45+3', '90+7'
    period_name,       -- First Half / Second Half / Extra Time
    minute_of_match,
    stoppage_offset,
    minute_type,       -- Regulation / Stoppage
    minute_bucket,     -- 0-15 … 45+ … 76-90 … 90+
    minute_bucket_sort
FROM minutes
Two details worth calling out. The surrogate key is deterministic (minute * 100 + offset), exactly like date_sk — the dimension is generated, not accumulated, so a fact rebuild can never shuffle references. And the stoppage range is sized from observed data with headroom: the longest legitimate stoppage minutes we’ve seen are 90+19 and 45+11, so the dimension generates up to +25. Anything beyond that is a source glitch and resolves to the Unknown row rather than inventing a minute.
192 rows in total. The fact joins to it on the label:
LEFT JOIN dim_match_minute dmm
    ON  dmm.minute_label = src.minute::VARCHAR
            || CASE WHEN src.extra_minute > 0 THEN '+' || src.extra_minute::VARCHAR ELSE '' END
    AND dmm.period_name  = src.period_name
That second condition is doing quiet defensive work. It isn’t needed for the join to resolve — it’s an anomaly guard. When the source says “first half” and also says “minute 60”, the two facts contradict each other, and rather than silently filing the event in a bucket that’s probably wrong, the join misses and the row lands on the Unknown minute. 131 events out of 52,071 — 0.25% — end up there. That’s the number being visible instead of hidden, which is the point.
The payoff shows up as soon as you plot it. Goals by bucket, across every season we hold:
| 0-15 | 16-30 | 31-45 | 45+ | 46-60 | 61-75 | 76-90 | 90+ |
|---|---|---|---|---|---|---|---|
| 1,336 | 1,544 | 1,648 | 174 | 1,676 | 1,698 | 1,815 | 563 |
A textbook curve — goals rise steadily toward a 76–90 peak — plus a 563-goal stoppage-time tail that a plain integer minute would have smeared into minute 90 and made invisible. More than three times the first-half stoppage tally, which is exactly what you’d expect and exactly the kind of thing you can only see if the model let you.
Two things the source doesn’t mean
Every dataset has columns that mean something other than what their name suggests. This one had two, and both were found the hard way.
sort_order is not a sequence
It reads like a match-global event ordering. It isn’t. sort_order is a per-event-family ordinal — “the 3rd goal”, “the 5th yellow card” — so comparing it across families is meaningless. A goal with sort_order = 2 did not necessarily happen before a card with sort_order = 3.
We never store it. What downstream actually wants — “the match’s Nth goal”, “the match’s Nth card” — is recomputed honestly:
ROW_NUMBER() OVER (
    PARTITION BY fixture_id, event_group
    ORDER BY period_sort, minute, extra_minute, sort_order
) AS event_group_sequence
The raw column survives only as the final tiebreaker within a group, where it’s genuinely valid. Everywhere else, the derived column replaces it. This is a small thing that would have been a large thing: a “first goalscorer” chart built on the raw column would have looked plausible and been subtly wrong.
Own goals are attributed to the wrong team (except they aren’t)
Here’s the one that cost the most time. The provider attributes an OWNGOAL event to the team that was awarded the goal — not the team whose player put it in his own net. So on an own-goal row, player_id belongs to the opposing team from team_id, by design.
We validated it exhaustively before believing it: 296 own goals, across every season and both leagues, checked against the result string on each event. 296 out of 296 confirmed the beneficiary convention, zero counterexamples.
Which is also why the running score in the fact is parsed from the provider’s result string rather than counted up from attributed goals:
COALESCE(LAST_VALUE(result_home_score IGNORE NULLS) OVER score_window, 0) AS home_score_after_event,
COALESCE(LAST_VALUE(result_away_score IGNORE NULLS) OVER score_window, 0) AS away_score_after_event
Roughly fifteen matches have a goal event attributed to the wrong team while the result string stays correct — so the string is the more trustworthy source, and a window function carries the last known score forward across every event in the match. Non-scoring events sharing a goal’s exact timestamp take the post-goal score by convention, which is what the CASE WHEN is_scoring THEN 0 ELSE 1 END in the window’s ORDER BY is for.
That gives every single event a game state attached to it: this substitution was made while 1–0 down, this red card came at 2–2. Comebacks, points-from-losing-positions, “leads lost” — all of it falls out of two columns that exist because we didn’t trust the obvious source.
And then the discovery. Having established the own-goal convention here, we went looking for who else had assumed the opposite — and found fct_player_appearances doing exactly that when deriving which team conceded a goal, which meant goalkeeper goals_conceded had been flipped in every match containing an own goal for as long as the model had existed. Around 296 own goals, up to ~590 wrong appearance rows, and everything built on clean-sheet analytics quietly inheriting the error. Fixed in a follow-up (#427), which then exposed a second bug stacked underneath it — scored penalties were being excluded from a team’s goals-against entirely. Prod mismatches went from 1,134 to 34, the remainder being genuine source gaps now covered by a warn-severity test.
Building a new fact at a finer grain audited an old one. That’s not a coincidence — it’s what happens when two facts have to agree about the same reality.
The reload unit: why the key is the match, not the event
Back to that plumbing footnote from the start. Because events are nested inside the fixture payload, the provider doesn’t patch individual events — it rewrites a fixture’s entire event list. When VAR overturns a goal twenty minutes after it was scored, the goal event doesn’t get a “rescinded” flag on the next fetch. It’s simply gone from the list.
Now consider the obvious incremental key, unique_key = event_id. New events get inserted, changed events get replaced — and the disallowed goal, which no longer exists upstream, stays in the fact table forever. Silently. Being counted.
So the fact’s unique key is the match, not the event:
{{ config(
    materialized='incremental',
    incremental_strategy='delete+insert',
    unique_key='match_sk'
) }}
Every fixture in the incremental window has all of its events deleted and reinserted as a unit. Deletions upstream become deletions downstream, automatically. The general rule, and one we’ll carry to future models: the incremental key should be whatever the source treats as an atomic unit of rewrite — which is not always the same as the fact’s grain. Here the grain is the event and the reload unit is the match, and conflating the two would have produced a table that only ever grew more wrong.
Sentinels: two kinds of missing
Our dimensions carry two sentinel rows: -1 Unknown and -2 Not Applicable. Match events were the first model where the distinction really earned its place, because a missing player means genuinely different things depending on the event:
CASE
    WHEN src.player_id IS NULL
         AND det.event_group IN ('Card', 'VAR') THEN -2   -- Not Applicable
    ELSE COALESCE(dp.player_sk, -1)                       -- Unknown
END AS player_sk
A card with no player is usually a bench or coaching-staff booking — there is no pitch player to name, and there never was. A VAR review with no player is a situational check (“was that offside in the build-up?”) that isn’t about one individual. Those are -2: the absence is correct and expected.
A goal with no player, or a substitution with no player, is different. Somebody scored it. Somebody came on. The data is missing. That’s -1, and it should look like a gap when you count it.
The FK-integrity test then encodes exactly which sentinels are tolerable:
-- Every event must resolve to a real match, date, league and event type.
-- (team/player/referee/minute may legitimately be Unknown or Not Applicable.)
SELECT 'match_sk' AS fk, ... FROM fct_match_events WHERE match_sk = -1
UNION ALL SELECT 'date_sk',             ... WHERE date_sk = -1
UNION ALL SELECT 'league_sk',           ... WHERE league_sk = -1
UNION ALL SELECT 'match_event_type_sk', ... WHERE match_event_type_sk = -1
An unresolved event type means the provider shipped something new and the taxonomy needs extending. An unresolved player means a bench booking, and is fine. Writing down which unknowns are acceptable is, as with the transfers fact, roughly half the value of the test.
The test that found a wrong scoreline
The most valuable test in the whole feature isn’t a column test at all. It’s a cross-fact conformance check: the final running score derived from the event stream must equal the goals fct_team_matches reports for the same match. Two facts, built from different source structures, forced to agree.
It failed on 284 matches at first — all of them symptoms of the own-goal attribution problem above, right total with one goal on the wrong side. Once that was fixed, one failure was left standing.
Ross County vs Aberdeen, 31 August 2024. Our fixture_scores said 1–1. The event stream said 0–1. Sky Sports and ESPN both say 0–1 — Aberdeen won. The provider’s scoreline was simply wrong, and fct_team_matches had been reporting a draw in a match Aberdeen took three points from, affecting their league position for a whole season.
It went into our fixture_score_corrections seed — a manual override table for exactly this, with the fixtures in it excluded from the reconciliation test since their official score deliberately disagrees with the raw feed. But the point isn’t the correction. The point is that a new fact table found a factual error in an old one, purely because we made the two of them prove they agreed. Testing a model against itself catches typos. Testing two independently-derived models against each other catches reality.
What we deliberately left out
Three things were cut from v1, and the reasons are as much a part of the model as what’s in it:
- Corners. Coverage exists in 2020/21 (111 of 193 matches) and 2021/22 (42 of 193), and nowhere else. Include them and every “corners per match” aggregate is silently wrong in a way nobody would notice — the number looks fine, it’s just built on a third of the matches. Partial coverage is more dangerous than no coverage.
related_player. The other half of a substitution (who came off) and the provider of an assist. No analytic we’d planned needed it, and fact columns can be added later far more easily than a grain can be changed. It did cost us something concrete: the Team page shows substitution timing, not substitution impact, because impact needs the on/off linkage. A known, priced trade-off rather than an accident.- Penalty shootout events. They never occur in league group-stage fixtures, which is all this fact covers.
Scope cuts driven by coverage rather than effort are the ones worth being disciplined about. “We could compute it” and “the answer would be true” are different questions.
Ten of twelve keys already existed
Now the part that made all of this affordable, and the reason we keep banging on about conformed dimensions.
fct_match_events has twelve foreign keys. Ten of them — dim_date, dim_time, dim_match, dim_league, dim_team, dim_opponent_team, dim_player, dim_referee, dim_stadium, dim_team_side — were already in the warehouse, already conformed, already used by the match and appearance facts. Building an entirely new business process at the finest grain we’d ever modelled required exactly two new dimensions.
And “conformed” isn’t a filing convention; it’s what makes the answers reconcile. Because the event fact joins the same dim_team as everything else, a club is the same entity with the same surrogate key on the Match page, the Team page and the League page — which is precisely why the cross-fact score reconciliation test above is even expressible. You cannot check that two facts agree if they don’t share the dimensions they’re agreeing about. The bug hunt in the previous section was a direct dividend of the boring discipline of conforming dimensions early.
There’s a second dividend that’s easy to miss: dim_match_minute and dim_match_event_type are themselves conformed from birth. Any future fact that needs “when in the match” — shot maps, possession sequences, xG timelines — joins the same minute dimension and its buckets line up with everything already built. That’s a column added to the bus matrix in the README, not a new warehouse.
From gold to six dashboard sections
One fact, six purpose-built marts, pre-aggregated at build time so the browser only ever filters:
- League → “The Rhythm of a Match” — goals per 15-minute bucket split home vs away, cards and substitutions on the same axis. The shape of a league’s ninety minutes.
- Team → “When Goals Happen” — scored vs conceded by minute, and substitution timing.
- Team → “Game State & Comebacks” — comeback wins, points won from losing positions, leads lost. All of it powered by those two running-score columns.
- Match → “Match Timeline” — a two-sided minute-by-minute rail, home left, away right, goals with the running score, cards, subs, VAR calls, half-time divider.
- Referee → “Card Timing” and “VAR Decisions” — when a referee reaches for the cards, and which teams the VAR calls went against.
One honesty note that belongs in this post more than in the release notes. VAR review counts are reliable back to 2020/21, but the outcome categorisation — goal disallowed, penalty cancelled, goal awarded — only becomes meaningful from 2024/25. Earlier seasons show real reviews with uncategorised outcomes. We could have hidden the empty seasons; we chose to render the sections always and let them show honest zeros, because a chart that quietly disappears teaches a user nothing while a chart showing nothing teaches them that the data starts in 2024/25.
What we took away
Grain is a decision about the future, not the present. Nobody asked for a minute-by-minute match timeline when this fact was designed. It exists because the grain was atomic enough to support a question that hadn’t been asked yet, and it cost nothing extra to build.
A column’s name is a hypothesis, not a specification. sort_order sounded like an ordering. participant_id on an own goal sounded like the team who scored it. Both were wrong, both were only discoverable by validating against something independent, and both would have produced dashboards that looked completely plausible while being wrong. Validate the assumption you’re least suspicious of — that’s where the expensive bugs live.
The reload unit is its own design decision. It defaults to the grain in most people’s heads, and here that default would have left overturned goals in the table permanently. Ask what the source treats as atomic, not what your fact does.
And the one that surprised us most: building a new fact is one of the best audits of your old ones. Two facts describing the same reality either agree or they don’t, and the moment you force them to prove it, you find out which of your existing tables has been quietly lying. We went looking for match events and came back with a goalkeeper-statistics bug, a penalty-attribution bug, and a wrong scoreline in a season-old match. None of those would have surfaced from testing any single model in isolation.