What Happens When You Share a Side Project on Reddit
On May 30 I posted the Superligaen Analytics dashboard to r/sportsanalytics. Three days later it had 6,200 views and was my number one Reddit post of all time.
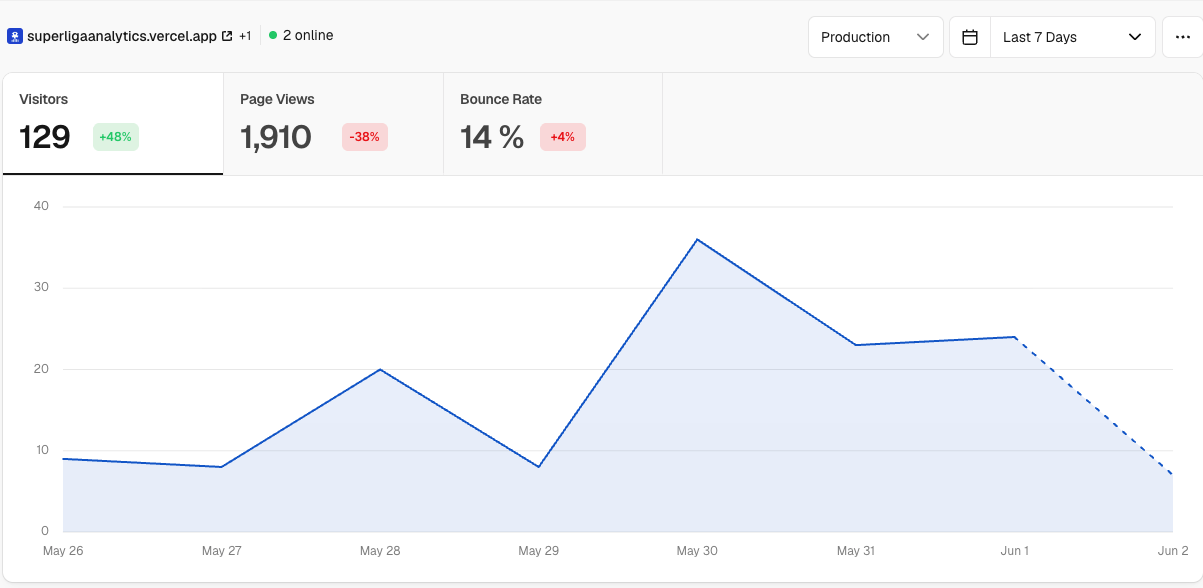
Here is what the traffic looked like.
The Numbers
6,200 Reddit views, 20 upvotes, 85.7% upvote ratio, 13 comments — over the three days following the post. On the site side, the week saw 129 visitors, 1,910 page views, and a 14% bounce rate. An average of roughly 15 pages per visitor.
The spike hit on May 30, the day of the post, peaking at around 35 visitors. What surprised me was the days after — May 31 and June 1 both held at around 23–24 visitors per day, roughly three times the pre-post baseline of 8–9. That kind of sustained lift usually means secondary sharing or return visits, not just a one-day curiosity bump.
Where the Visitors Came From
The site visitor geography tells two stories at once.
| Country | Visitors | Share |
|---|---|---|
| Denmark | 69 | 52% |
| United States | 9 | 7% |
| United Kingdom | 7 | 5% |
| Germany | 5 | 4% |
| Türkiye | 5 | 4% |
| Other | 34 | 26% |
Denmark is still dominant at 52% — the ongoing organic audience from the LinkedIn post kept arriving throughout the week. But the Reddit post brought a genuinely international tail that was not there before: the US, UK, Germany, and a long list of countries with no obvious connection to Danish football. Hungary, Morocco, South Korea, Uganda, Zambia — the post reached places the LinkedIn share never did.
The Reddit post viewer geography told a different story: the US was 26% of Reddit views, Denmark only 8%. That gap between who read the post and who clicked through to the site is the interesting part. The engineering angle attracted a broad international audience on Reddit, but the Danes in that audience were significantly more likely to actually visit the dashboard — which makes sense, since they have a reason to care about the content once they arrive.
What a 14% Bounce Rate Means Here
The LinkedIn bounce rate was 16%. Reddit came in at 14%. Almost identical, despite being a completely different audience arriving from a completely different context.
86% of visitors who landed from a technical Reddit thread explored beyond the first page, averaging 15 pages per session. These were not people with any prior reason to care about Danish football standings or player radars. They came because of the architecture and stayed because the product held up.
The Post-Spike Baseline
The pre-post baseline was around 8–9 visitors per day. After the spike it settled at roughly 23–24 — about three times higher, with no further promotion. That suggests some organic sharing continued after the initial Reddit exposure.
It is a different pattern from LinkedIn, where the spike was sharper and the return to baseline was faster. The Reddit audience appears to have generated more durable downstream traffic, possibly because technical communities are more likely to bookmark, share in Slack, or link from other posts.
The Danish football communities have not seen this yet. That will be a different experiment — the same product, but an audience that cares about the football and not the architecture. I expect the geographic distribution to look a lot more like the LinkedIn post.